29. Mini Project: Dermatologist AI
Mini Project: Dermatologist AI
Introduction
In this mini project, you will design an algorithm that can visually diagnose melanoma, the deadliest form of skin cancer. In particular, your algorithm will distinguish this malignant skin tumor from two types of benign lesions (nevi and seborrheic keratoses).
The data and objective are pulled from the 2017 ISIC Challenge on Skin Lesion Analysis Towards Melanoma Detection. As part of the challenge, participants were tasked to design an algorithm to diagnose skin lesion images as one of three different skin diseases (melanoma, nevus, or seborrheic keratosis). In this project, you will create a model to generate your own predictions.

Getting Started
- Clone the repository and create a
data/folder to hold the dataset of skin images.
git clone https://github.com/udacity/dermatologist-ai.git
mkdir data; cd data- Create folders to hold the training, validation, and test images.
mkdir train; mkdir valid; mkdir testDownload and unzip the training data (5.3 GB).
Download and unzip the validation data (824.5 MB).
Download and unzip the test data (5.1 GB).
Place the training, validation, and test images in the
data/folder, atdata/train/,data/valid/, anddata/test/, respectively. Each folder should contain three sub-folders (melanoma/,nevus/,seborrheic_keratosis/), each containing representative images from one of the three image classes.
You are free to use any coding environment of your choice to solve this mini project! In order to rank your results, you need only use a pipeline that culminates in a CSV file containing your test predictions.
Create a Model
Use the training and validation data to train a model that can distinguish between the three different image classes. (After training, you will use the test images to gauge the performance of your model.)
If you would like to read more about some of the algorithms that were successful in this competition, please read this article that discusses some of the best approaches. A few of the corresponding research papers appear below.
- Matsunaga K, Hamada A, Minagawa A, Koga H. “Image Classification of Melanoma, Nevus and Seborrheic Keratosis by Deep Neural Network Ensemble”. International Skin Imaging Collaboration (ISIC) 2017 Challenge at the International Symposium on Biomedical Imaging (ISBI).
- Daz IG. “Incorporating the Knowledge of Dermatologists to Convolutional Neural Networks for the Diagnosis of Skin Lesions”. International Skin Imaging Collaboration (ISIC) 2017 Challenge at the International Symposium on Biomedical Imaging (ISBI). (github)
- Menegola A, Tavares J, Fornaciali M, Li LT, Avila S, Valle E. “RECOD Titans at ISIC Challenge 2017”. International Skin Imaging Collaboration (ISIC) 2017 Challenge at the International Symposium on Biomedical Imaging (ISBI). (github)
While the original challenge provided additional data (such as the gender and age of the patients), we only provide the image data to you. If you would like to download this additional patient data, you may do so at the competition website.
All three of the above teams increased the number of images in the training set with additional data sources. If you'd like to expand your training set, you are encouraged to begin with the ISIC Archive.
Evaluation
Inspired by the ISIC challenge, your algorithm will be ranked according to three separate categories.
Category 1: ROC AUC for Melanoma Classification
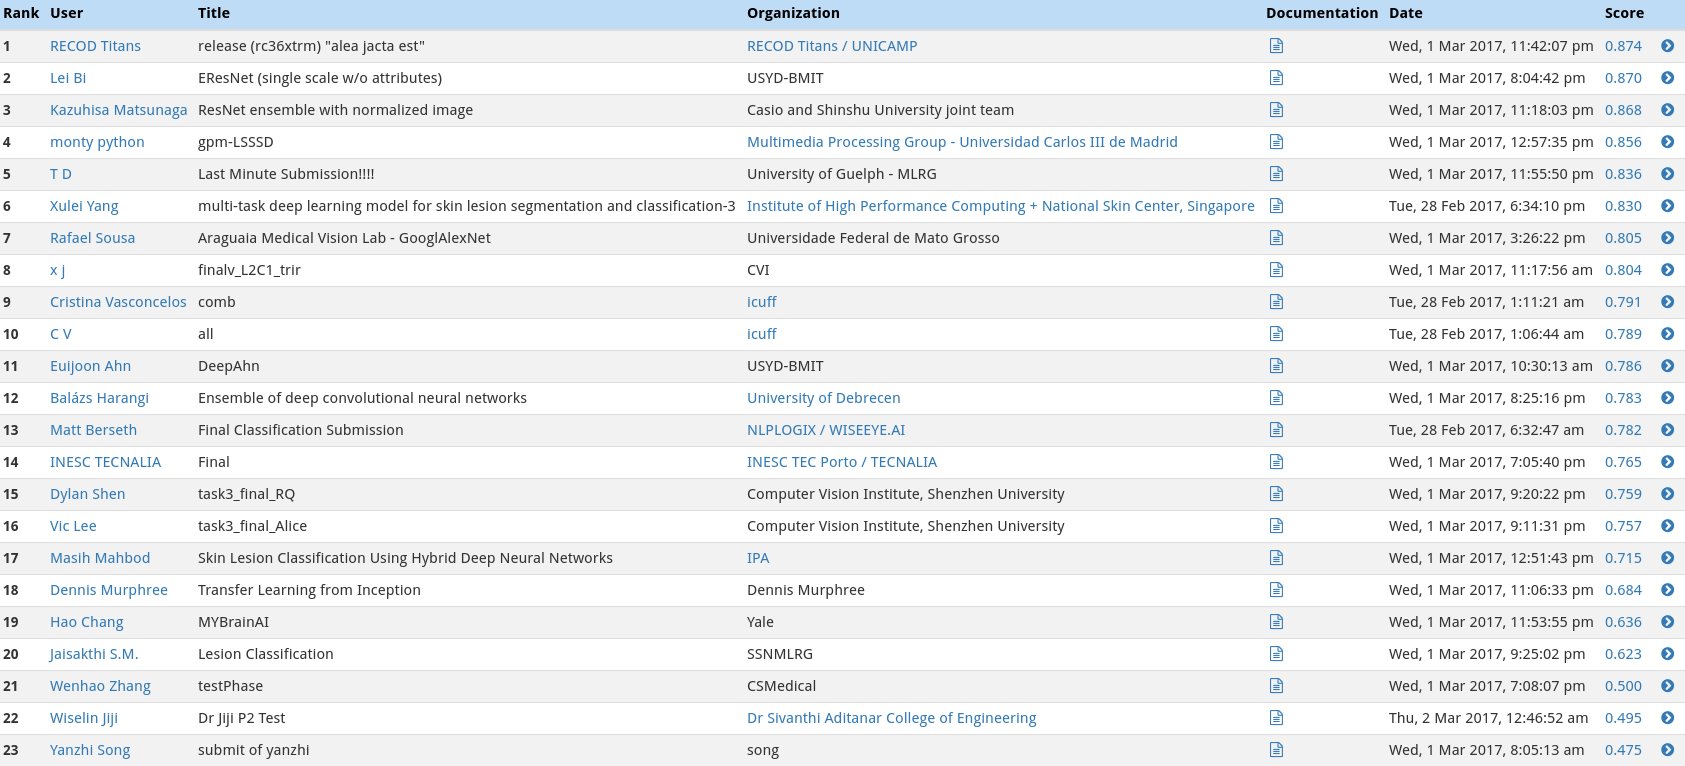
In the first category, we will gauge the ability of your CNN to distinguish between malignant melanoma and the benign skin lesions (nevus, seborrheic keratosis) by calculating the area under the receiver operating characteristic curve (ROC AUC) corresponding to this binary classification task.
If you are unfamiliar with ROC (Receiver Operating Characteristic) curves and would like to learn more, you can check out the documentation in scikit-learn or read this Wikipedia article.
The top scores (from the ISIC competition) in this category can be found in the image below.
Category 2: ROC AUC for Melanocytic Classification
All of the skin lesions that we will examine are caused by abnormal growth of either melanocytes or keratinocytes, which are two different types of epidermal skin cells. Melanomas and nevi are derived from melanocytes, whereas seborrheic keratoses are derived from keratinocytes.
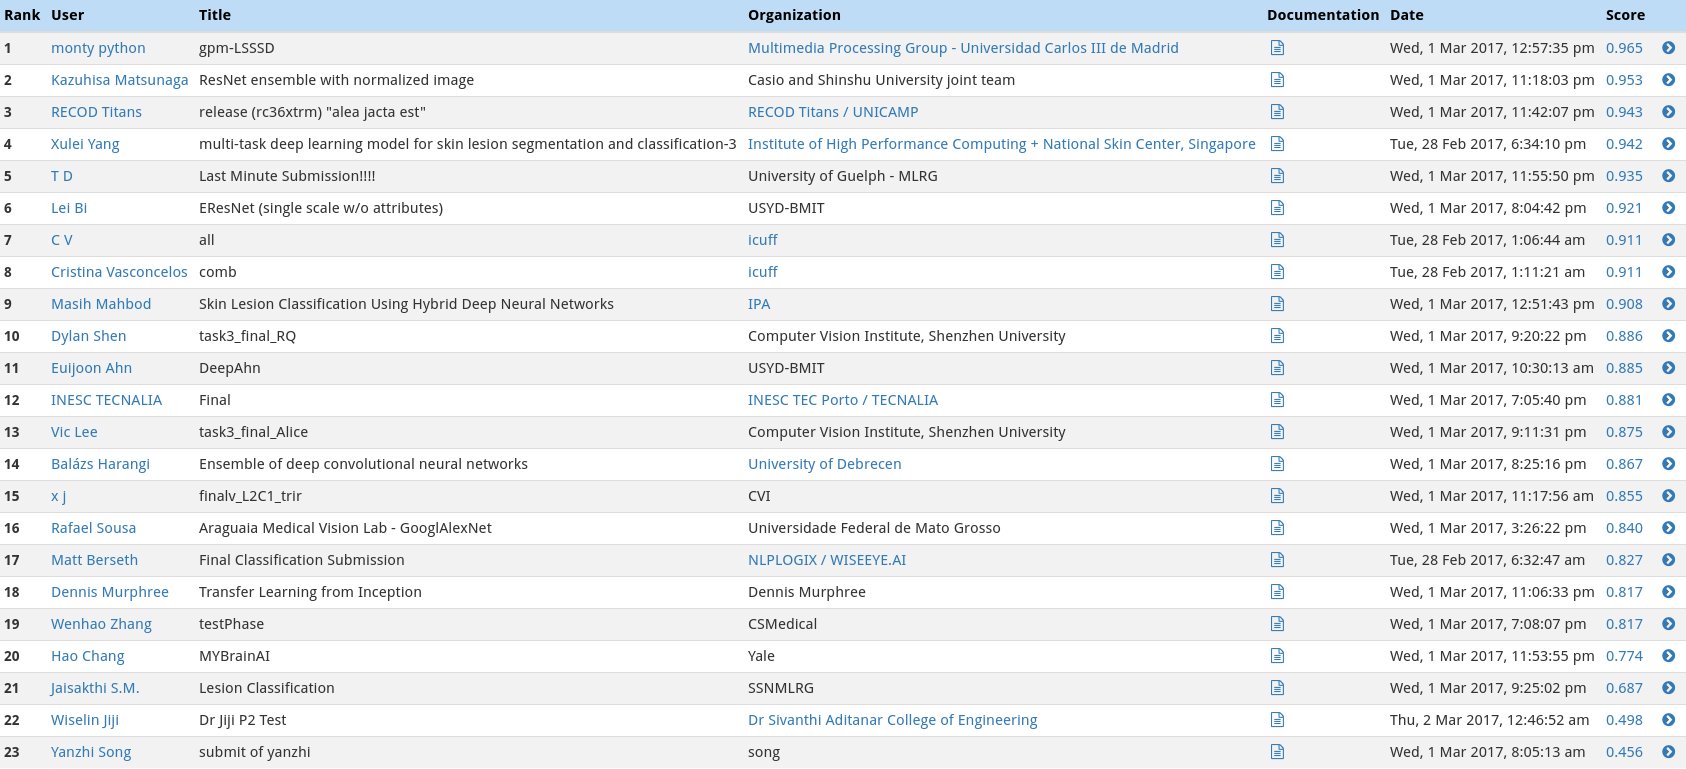
In the second category, we will test the ability of your CNN to distinuish between melanocytic and keratinocytic skin lesions by calculating the area under the receiver operating characteristic curve (ROC AUC) corresponding to this binary classification task.
The top scores in this category (from the ISIC competition) can be found in the image below.
Category 3: Mean ROC AUC
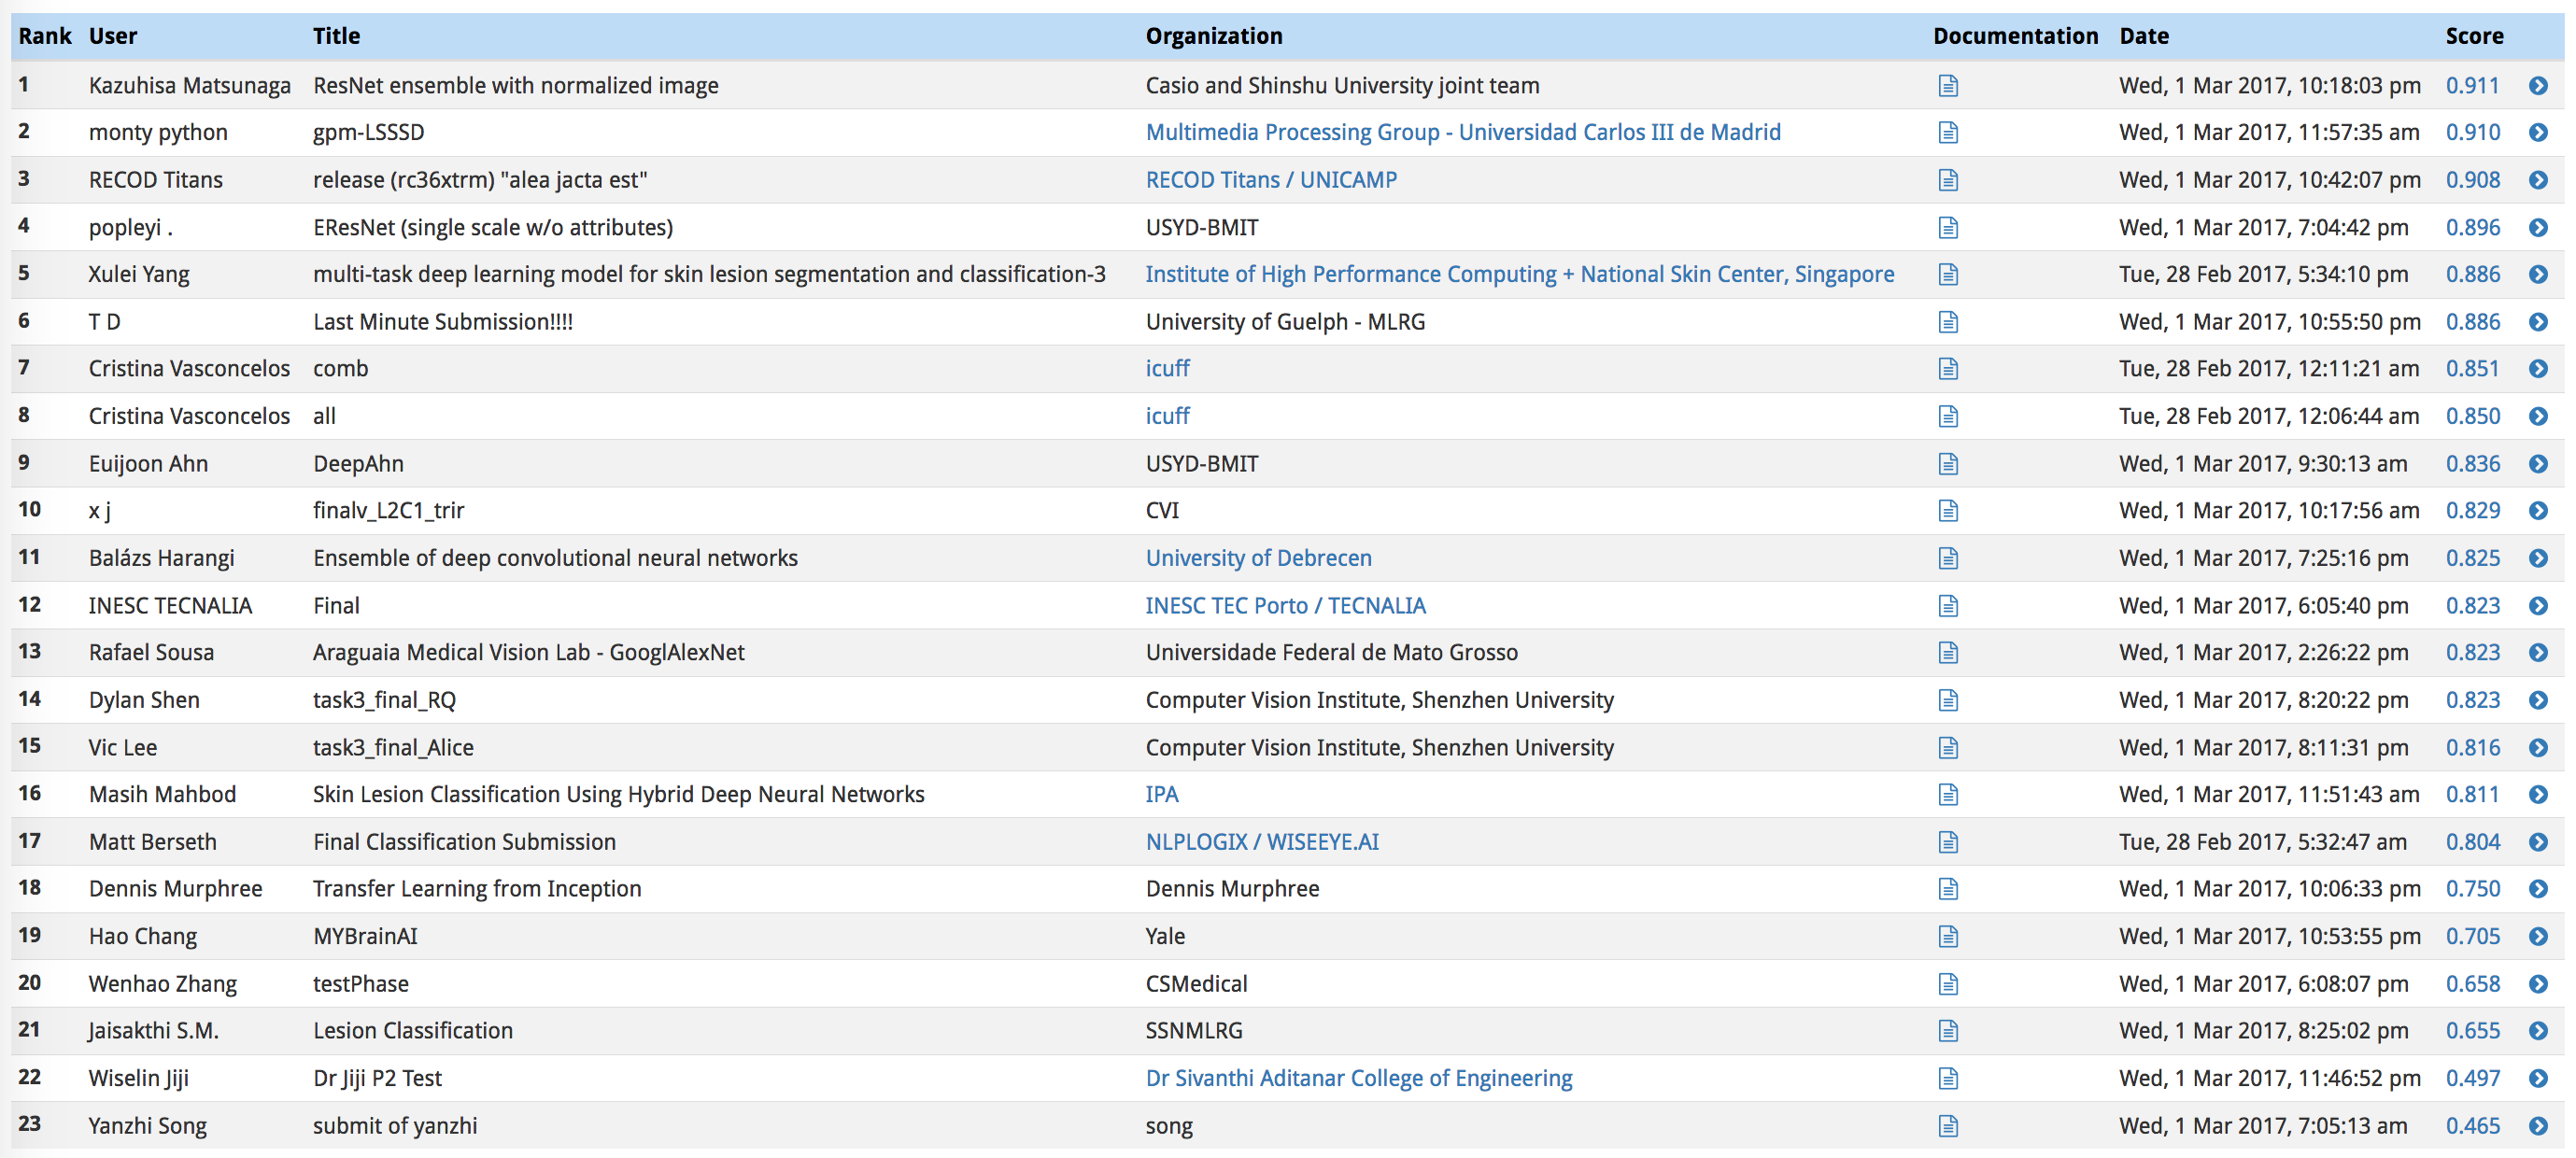
In the third category, we will take the average of the ROC AUC values from the first two categories.
The top scores in this category (from the ISIC competition) can be found in the image below.
Getting your Results
Once you have trained your model, create a CSV file to store your test predictions. Your file should have exactly 600 rows, each corresponding to a different test image, plus a header row. You can find an example submission file (sample_submission.csv) in the repository.
Your file should have exactly 3 columns:
Id- the file names of the test images (in the same order as the sample submission file)task_1- the model's predicted probability that the image (at the path inId) depicts melanomatask_2- the model's predicted probability that the image (at the path inId) depicts seborrheic keratosis
Once the CSV file is obtained, you will use the get_results.py file to score your submission. To set up the environment to run this file, you need to create (and activate) an environment with Python 3.5 and a few pip-installable packages:
conda create --name derm-ai python=3.5
source activate derm-ai
pip install -r requirements.txt
Once you have set up the environment, run the following command to see how the sample submission performed:
python get_results.py sample_predictions.csvCheck the terminal output for the scores obtained in the three categories:
Category 1 Score: 0.526
Category 2 Score: 0.606
Category 3 Score: 0.566
The corresponding ROC curves appear in a pop-up window, along with the confusion matrix corresponding to melanoma classification.
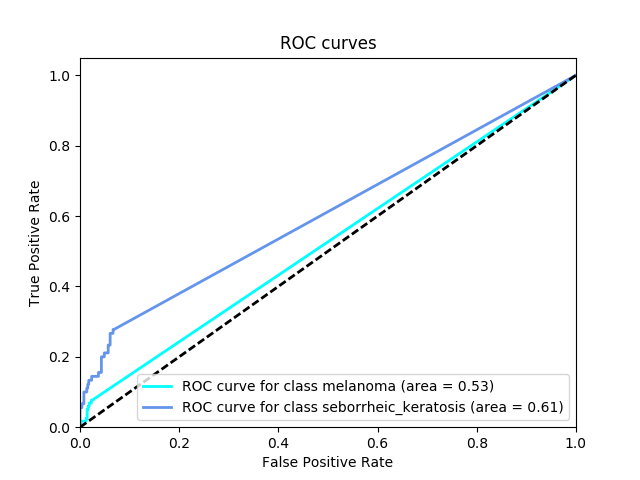
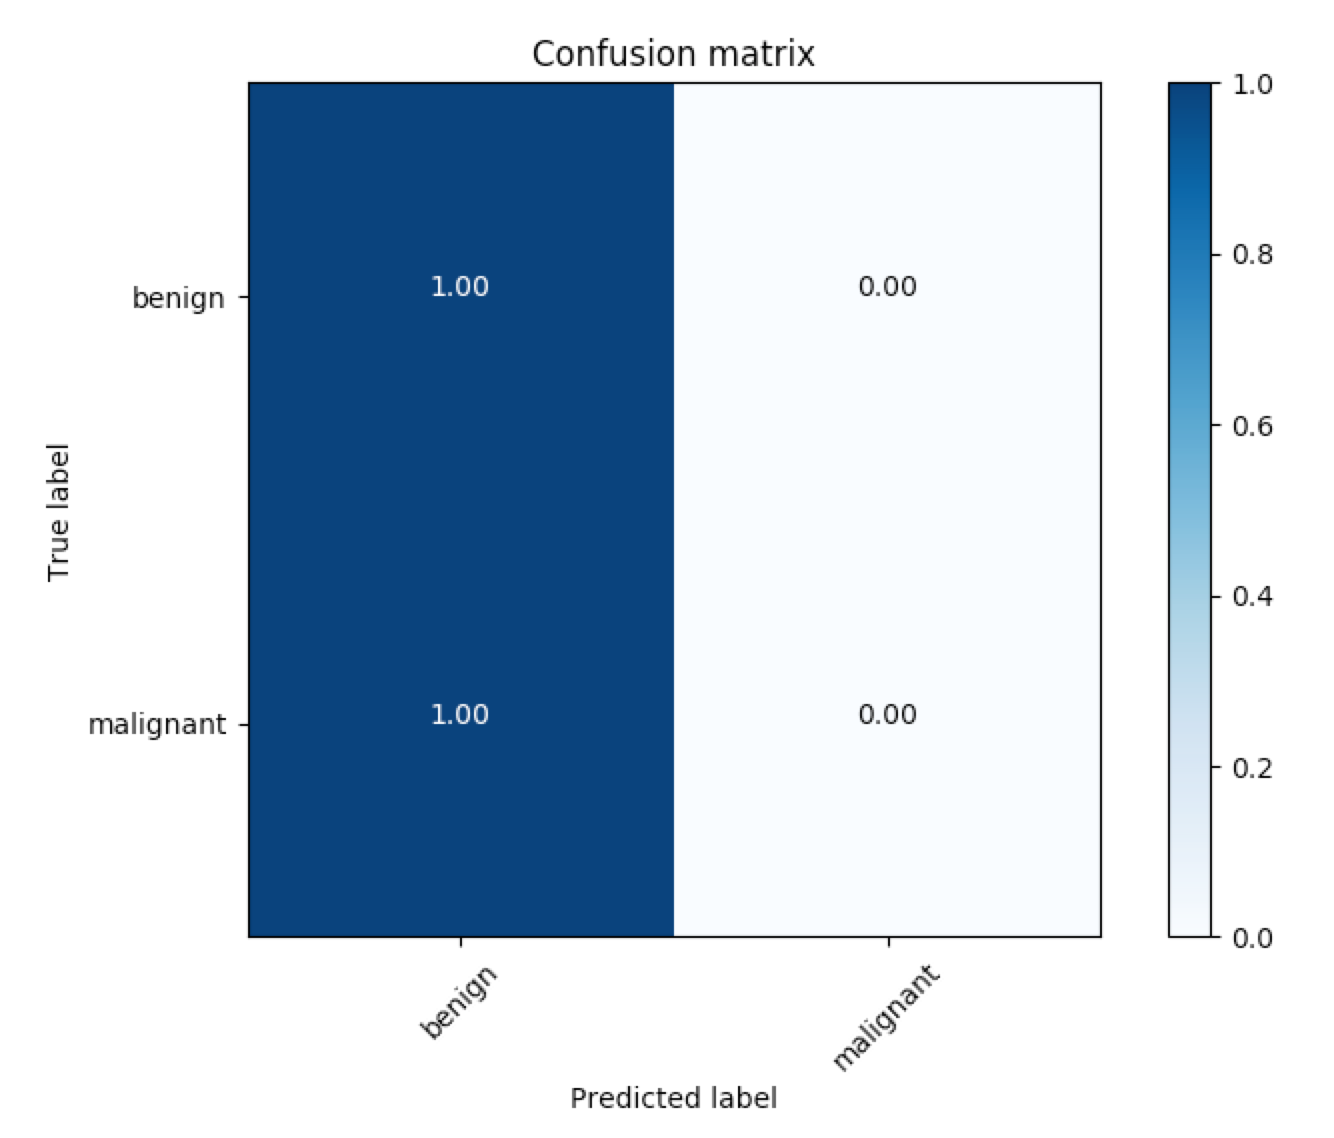
As you can see from the confusion matrix, the sample submission currently predicts that most of the images in the test dataset correspond to benign lesions. Let's see if your model can improve these results, towards better detecting cancer!
The code for generating the confusion matrix assumes that the threshold for classifying melanoma is set to 0.5. To change this threshold, you need only supply an additional command-line argument when calling the get_results.py file. For instance, to set the threshold at 0.4, you need only run:
python get_results.py sample_predictions.csv 0.4To test your own submission, change the code to instead include the path to your CSV file.